
[BirdCLEF+] Dataset, Mel’s Spectrogram
Dataset Explanation
by GPT
- train_audio/
- 32kHz,
oggformat [collection][file_id_in_collection].ogg- Includes birds, amphibians, mammals, insects
- No benefit in scraping external sources
- 32kHz,
- test_soundscapes/
- 32kHz,
oggformat soundscape_xxxxxx.ogg- ~700 recordings, 1 minute each
- Randomized filenames
- Not all train species appear here
- 32kHz,
- train_soundscapes/
- 32kHz,
oggformat [site]_[date]_[local_time].ogg- Unlabeled audio from same general locations as test set
- No overlap in exact recording sites with test data
- 32kHz,
- train.csv
- Metadata for
train_audio - Fields:
primary_label: species code (eBird/iNat ID)secondary_labels: other species possibly presentlatitude,longitude: recording locationauthor,filename,rating,collection
- Metadata for
- sample_submission.csv
- Template format for predictions
row_id:soundscape_[soundscape_id]_[end_time]- 206 species ID columns (predict probabilities)
- taxonomy.csv
- Species info
- Includes iNat taxon ID and class name (Aves, Amphibia, Mammalia, Insecta)
- recording_location.txt
- High-level location info (e.g., El Silencio Natural Reserve)
Transforming Audio-to-Mel Spec.
https://www.kaggle.com/code/kadircandrisolu/transforming-audio-to-mel-spec-birdclef-25
- 결측치 처리
	if np.isnan(audio_data).any():
	    mean_signal = np.nanmean(audio_data)
	    audio_data = np.nan_to_num(audio_data, nan=mean_signal)
- `NaN`이 포함되었는지 확인, 있다면 전체 오디오의 평균으로 NaN을 채움.
- 변환과정에서 오류가 나지 않도록 Pre-precessing하는 단계 2. Mel Spectrogram 생성
	mel_spec = librosa.feature.melspectrogram(
	    y=audio_data,
	    sr=config.FS,
	    n_fft=config.N_FFT,
	    hop_length=config.HOP_LENGTH,
	    n_mels=config.N_MELS,
	    fmin=config.FMIN,
	    fmax=config.FMAX,
	    power=2.0
	)
- `librosa`를 사용해서 **Mel Spectrogram** 생성
- 인자 설명:
	- `y`: 오디오 신호 (1D array)
	- `sr`: 샘플링 레이트 (`config.FS`, 예: 32000Hz)
	- `n_fft`: FFT 크기 (주파수 해상도 조절)
	- `hop_length`: 윈도우 사이의 간격 (시간 해상도)
	- `n_mels`: Mel filter bank 개수 (출력 스펙트럼의 세로 크기)
	- `fmin`, `fmax`: 분석할 주파수 범위
	- `power=2.0`: 파워 스펙트럼 (제곱값 사용)
- → 결과는 **Mel 주파수 축 기준의 파워 스펙트럼** (2D array) 3. Decibel scale로 변환
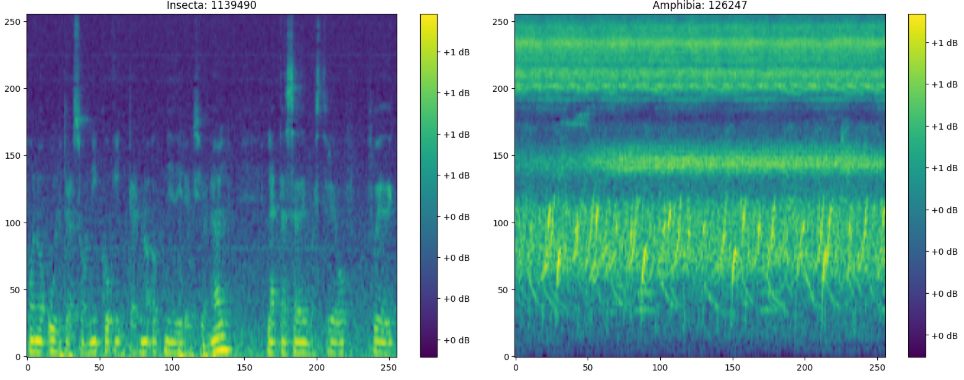
mel_spec_db = librosa.power_to_db(mel_spec, ref=np.max)
- `ref=np.max` : 가장 큰 값을 0db로 하여, 상대적 데시벨을 계산 4. Normalization
mel_spec_norm = (mel_spec_db - mel_spec_db.min()) / (mel_spec_db.max() - mel_spec_db.min() + 1e-8)
- Normalize 후 divide by zero 에러 방지를 위해 1e-8 더함 - 코드 실행 예시
-
power_to_db를 뺐을 때의 예시
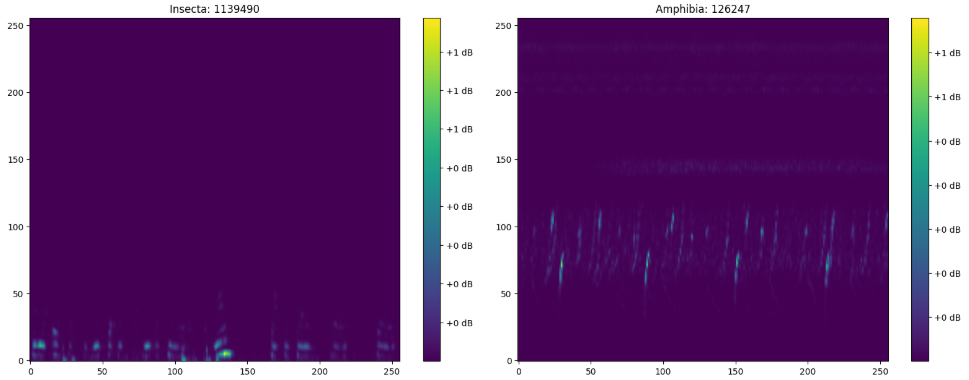
-
Normalization을 하지 않았을 때의 예시는 원본 코드와 동일하게 나오나, Color Bar의 축척이 0dB부터 -90dB로 바뀐다.
Mel Spectrogram에 관한 설명 : https://velog.io/@eunjnnn/Understanding-the-Mel-Spectrogram
-
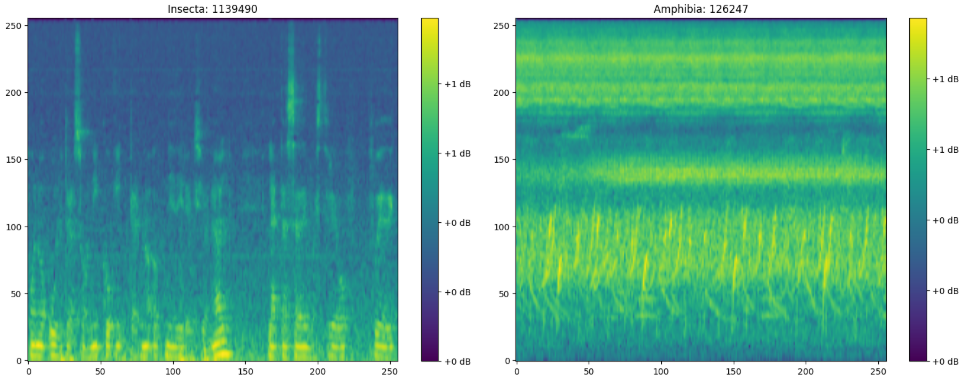
n_mels : y축 해상도를 128 → 256으로 변환
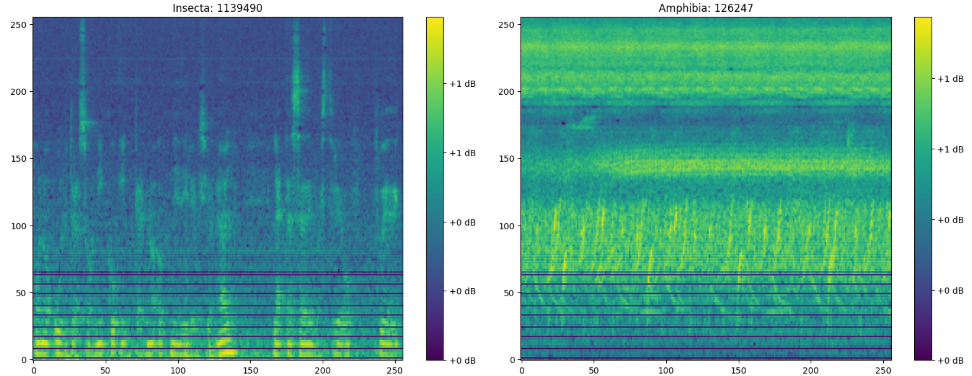
-
n_mels : 128 → 64
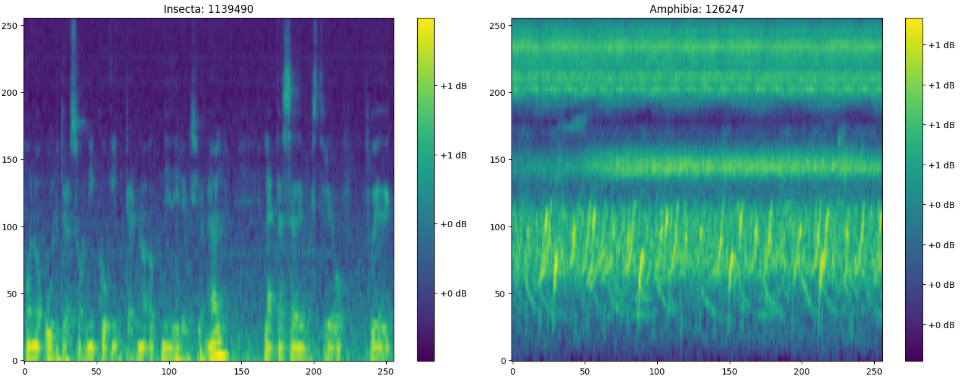
-
FMAX = 16000 # Nyquist Sampling Theorem에 의해 32kHz 데이터는 f=16k까지만 가능
- Normalization하는 과정에서 원래 낮은 값 부분(보라색)이 초록색으로 값이 덮힌 것을 알 수 있음. → 어차피 영향을 주지 않는 High freq 부분을 조금 잘라내는 대신 contrast를 명확하게 하기 위해 FMAX=14000으로 설정한게 아닐까 싶음
댓글을 불러오는 중입니다.